Factor Analysis

Factor Analysis is a statistical technique used to identify underlying relationships between observed variables and reduce data’s dimensionality. This is done by summarizing the shared variance among them. It’s widely employed in psychology, sociology, market research, and other fields to explore complex relationships among variables and uncover latent factors that explain the patterns in the data.

Understanding Factor Analysis

Factor Analysis aims to identify fewer unobservable variables, known as factors, that capture the common variance among a more extensive set of observed variables. These factors represent underlying dimensions or constructs that explain the patterns observed in the data. Factor Analysis assumes that the observed variables are linear combinations of the underlying factors plus error terms.

Types of Factor Analysis

Different types of Factor Analysis exist, including exploratory factor analysis (EFA) and confirmatory factor analysis (CFA). EFA is used when the researcher wants to explore the data structure and identify the underlying factors without preconceived hypotheses about their relationships. Conversely, CFA tests specific assumptions about the relationships between observed variables and predefined factors.

Assumptions and Limitations

Factor Analysis relies on several assumptions, including the linearity of relationships between observed variables and factors, the absence of multicollinearity, and the adequacy of sample size. It’s essential to ensure that the data meet these assumptions for Factor Analysis to produce reliable results. Additionally, Factor Analysis may not be suitable for small sample sizes or when the observed variables are highly correlated.

Applications of Factor Analysis

Factor Analysis finds applications in various fields, including psychology, where it’s used to identify underlying personality traits or intelligence factors. Marketing research can help identify consumer preferences and segment markets based on common product usage patterns. Moreover, it’s employed in sociology to explore social attitudes or cultural dimensions underlying survey data.

Interpreting Factor Analysis Results

Factor Analysis produces several outputs, including factor loadings, communalities, and eigenvalues. Factor loadings represent the correlation between observed variables and underlying factors, while commonalities indicate the proportion of variance in each observed variable explained by the factors. Additionally, Eigenvalues represent the amount of variance explained by each factor. Researchers interpret these results to identify meaningful factors and their relationships with observed variables.

Conclusion

Factor Analysis is a powerful statistical technique for exploring relationships among observed variables and uncovering underlying dimensions or constructs in data. It provides valuable insights into the structure of complex datasets and helps researchers understand the latent factors driving the observed patterns. Despite its assumptions and limitations, Factor Analysis remains a widely used method in various research disciplines. Specifically, it offers a systematic approach to data reduction and exploration of multidimensional data.

Related Blogs

  1. Unraveling Relationships: Your Guide to Correlation and Regression Analysis
  2. Analysis of variance (ANOVA)
  3. Chi-square tests 


Needs help with similar assignment?

We are available 24x7 to deliver the best services and assignment ready within 3-4 hours? Order a custom-written, plagiarism-free paper

Get Answer Over WhatsApp Order Paper Now

Chi-Square Test

The Chi-square test is a statistical method used to determine whether there is a significant association between two categorical variables. It’s named after the Greek letter “χ²” (chi-square), which represents the sum of squared differences between observed and expected frequencies. This test is widely used across various fields, including social sciences, biology, and market research, to analyze categorical data and assess relationships between variables.

Understanding the Chi-Square Test

The Chi-square test compares the observed frequencies of categories in a contingency table to the frequencies that would be expected if the variables were independent. It calculates a test statistic, denoted as χ², which quantifies the extent of the discrepancy between observed and expected frequencies. The higher the value of χ², the greater the difference between observed and expected frequencies, indicating a stronger association between the variables.

Types of Chi-Square Tests

There are different types of Chi-square tests, each suited for different research questions and data types. The most common ones include the chi-square test for independence and the chi-square test for goodness of fit. The chi-square test for independence assesses whether there is a significant association between two categorical variables in a contingency table. On the other hand, the chi-square test for goodness of fit determines whether the observed frequency distribution of a single categorical variable fits a hypothesized distribution.

click here to view an example

Assumptions and Limitations

The Chi-square test has several assumptions, including the independence of observations and the appropriateness of sample size. It’s crucial to ensure that the sample size is adequate for the analysis and that the observations are independent to obtain reliable results. Additionally, the test is sensitive to small sample sizes and may produce inaccurate results if the expected frequencies in any cell of the contingency table are too low.

Applications of Chi-Square Test

The Chi-square test finds applications in various research scenarios. For example, in social sciences, it might be used to examine the relationship between gender and voting preference in an election. In biology, it could be employed to assess whether there is a significant association between smoking status and the development of lung cancer. Moreover, market research could help determine whether there is a significant relationship between product preferences and the demographic characteristics of consumers.

Interpreting Chi-Square Test Results

The Chi-square test produces a test statistic, χ², and its associated p-value. If the p-value is less than a predetermined significance level (usually 0.05), it indicates that there is a significant association between the variables. In such cases, the null hypothesis of independence is rejected, suggesting that the observed frequencies are unlikely to occur by chance alone. However, if the p-value is greater than the significance level, there is insufficient evidence to reject the null hypothesis, and the variables are considered independent.

click here to view an example

Conclusion

In conclusion, the Chi-square test is a valuable statistical tool for analyzing categorical data and assessing relationships between variables. It is widely used across various disciplines to investigate associations, test hypotheses, and make informed decisions based on empirical evidence. Despite its assumptions and limitations, the Chi-square test remains a fundamental method in the toolkit of researchers and analysts, providing insights into the patterns and dependencies present in categorical data.


Related  blogs
  1. Measure of variance (ANOVA)
  2. Histogram, definition types and example
  3. Measure of variance Range, Variance, and Standard Deviation

Needs help with similar assignment?

We are available 24x7 to deliver the best services and assignment ready within 3-4 hours? Order a custom-written, plagiarism-free paper

Get Answer Over WhatsApp Order Paper Now

Analysis of Variance (ANOVA)

Introduction to Analysis of Variance (ANOVA)

Analysis of Variance (ANOVA) is a statistical method used to compare means between two or more groups. It’s a powerful tool in research and data analysis, enabling researchers to determine whether there are significant differences among the means of multiple groups. ANOVA essentially examines the variance within groups and between groups to assess whether any observed differences are likely due to random variation or if they represent actual differences.

Understanding ANOVA

ANOVA works by partitioning the total variance observed in a dataset into different components: the variance within each group and the variance between the groups. By comparing these variances, ANOVA helps determine whether the differences between group means are statistically significant.

Types of ANOVA

There are several types of ANOVA, each suited for different research designs. The most common ones include one-way ANOVA, which compares means across one categorical independent variable with two or more levels, and two-way ANOVA, which extends the analysis to include two independent variables and their interaction effect.

Assumptions and Limitations

One of the critical assumptions of ANOVA is that the data within each group are normally distributed and have equal variances, known as homogeneity of variances. Violations of this assumption can affect the accuracy of the results. However, ANOVA is relatively robust to violations of normality when sample sizes are large enough.

Applications of ANOVA

ANOVA has numerous applications across various fields, including psychology, biology, economics, and more. For example, in psychology, ANOVA might be used to compare the effectiveness of different therapeutic interventions on depression symptoms. In biology, it could be employed to assess the impact of different fertilizers on crop yield.

Interpreting ANOVA Results

The results of ANOVA are typically reported in an F-statistic, which compares the variance between groups to the variance within groups. Suppose the F-statistic is sufficiently large and the associated p-value is small (typically less than 0.05). In that case, it indicates that there are significant differences between at least two of the group means. Post-hoc tests, such as Tukey’s HSD or Bonferroni correction, are often conducted to identify which specific groups differ from each other.

Conclusion

In conclusion, Analysis of Variance (ANOVA) is a versatile statistical technique used to compare means across multiple groups. It is widely employed in research and data analysis to assess differences between groups and determine whether these differences are statistically significant. Despite its assumptions and limitations, ANOVA remains a fundamental tool in the arsenal of statisticians and researchers, providing valuable insights into the relationships between variables in diverse fields of study.

Related Blogs

  1. Regression Analysis
  2. Correlation Analysis
  3. T-test


Needs help with similar assignment?

We are available 24x7 to deliver the best services and assignment ready within 3-4 hours? Order a custom-written, plagiarism-free paper

Get Answer Over WhatsApp Order Paper Now

Elevate Your Academic Journey: College Statistics Homework Help

Welcome to CustomHomeworkHelp.com, your trusted companion on the path to academic excellence! Today, we’re delving into a subject that often leaves students scratching their heads: college statistics. From probability distributions to regression analysis, college statistics assignments can be as challenging as they are crucial to your academic success.

But fear not! CustomHomeworkHelp.com is here to provide you with the support and guidance you need to navigate the complexities of college-level statistics with confidence and ease.

Here’s why our college statistics homework help services are a game-changer:
  1. Expert Guidance: Our team of experienced tutors comprises seasoned statisticians and educators who possess a deep understanding of college-level statistics. Whether you’re grappling with hypothesis testing, ANOVA, or chi-square analysis, our experts are here to offer personalized guidance tailored to your unique learning needs.
  2. Comprehensive Support: College statistics encompasses a wide array of topics, from descriptive statistics to inferential statistics and beyond. Our comprehensive support services cover all aspects of the curriculum, ensuring that you receive assistance with any topic or assignment, no matter how challenging.
  3. Quality Solutions: When it comes to college assignments, quality is paramount. Our tutors are committed to delivering accurate, well-researched solutions that meet the highest academic standards. Whether you need help with homework assignments, projects, or exam preparation, you can trust CustomHomeworkHelp.com to provide solutions that earn you top grades.
  4. Timely Assistance: Tight deadlines are a common source of stress for college students. With CustomHomeworkHelp.com, you never have to worry about missing deadlines again. Our team works diligently to ensure the timely delivery of all assignments, allowing you to submit your work with confidence and peace of mind.
  5. Concept Mastery: College statistics isn’t just about memorizing formulas and crunching numbers—it’s about developing a deep conceptual understanding of statistical principles and methodologies. Our tutors go beyond rote learning to help you master the underlying concepts, empowering you to apply statistical techniques with clarity and precision.
  6. Future Success: Whether you’re majoring in mathematics, economics, psychology, or any other field, proficiency in statistics is essential for success in both your academic and professional endeavors. By investing in college statistics homework help today, you’re laying the foundation for a future filled with opportunities and achievements.

At CustomHomeworkHelp.com, we’re dedicated to helping college students unlock their full academic potential. With our expert guidance, comprehensive support, and unwavering commitment to excellence, you can conquer college statistics with confidence and embark on a journey of lifelong learning and achievement.

Ready to elevate your academic journey? Visit CustomHomeworkHelp.com today and take the first step toward academic success!

Needs help with similar assignment?

We are available 24x7 to deliver the best services and assignment ready within 3-4 hours? Order a custom-written, plagiarism-free paper

Get Answer Over WhatsApp Order Paper Now

Frequency Distribution: Tables, Types & Examples

Frequency distribution is a fundamental concept in statistics that helps in organizing and summarizing data. By presenting data in a tabular format, frequency distribution facilitates analysis and interpretation. In this blog post, we will delve into the basics of frequency distribution, explore different types, and provide examples to enhance understanding.

What is Frequency Distribution?

Frequency distribution is a foundational concept in statistics, serving as a methodical approach to organizing and analyzing data. At its core, frequency distribution entails categorizing data values based on how frequently they occur within a dataset. This categorization is typically presented in the form of a table, where each unique value (or range of values) is paired with its corresponding frequency or count.

Components
  • Data Values: These are the individual observations or measurements within a dataset. They could represent anything from test scores and ages to product sales or temperature readings.
  • Frequency: This refers to the number of times a specific data value occurs within the dataset. It quantifies the occurrence or repetition of each value and provides insight into its relative importance within the dataset.
Constructing a Frequency Distribution
  1. Identification of Data Set: The process begins by identifying the complete range of data values present in the dataset. This involves examining all the individual observations to determine the scope of the data.
  2. Categorization into Classes: Once the range of data values is established, it is divided into distinct intervals or classes. These classes are mutually exclusive and collectively exhaustive, ensuring that every data value falls into one and only one class.
  3. Counting Frequencies: Each data value is then assigned to its respective class, and the frequency of occurrences within each class is tallied. This involves counting the number of times each value falls within its designated class.
  4. Tabular Representation: The final step involves organizing the classes and their corresponding frequencies into a structured table format. This frequency distribution table provides a clear and concise summary of the distribution of data values within the dataset.
Significance and Utility

Frequency distribution serves several critical purposes in statistical analysis

  • Pattern Recognition: By summarizing the distribution of data values, frequency distribution allows analysts to identify patterns, trends, and outliers within the dataset.
  • Data Summarization: It provides a succinct summary of the dataset’s characteristics, making it easier to comprehend and interpret complex data.
  • Decision Making: Frequency distribution informs decision-making processes by providing valuable insights into the distribution and frequency of various data values, aiding in forecasting, planning, and problem-solving endeavors.

In essence, frequency distribution serves as a cornerstone of statistical analysis, providing a structured framework for understanding the distributional properties of data and facilitating informed decision-making processes.

Types of Frequency Distribution

Frequency distribution manifests in various forms, each catering to specific data characteristics and analytical needs. Here are the primary types:

Simple Frequency Distribution

This type enumerates all unique data values in the dataset alongside their respective frequencies. It is ideal for datasets with a manageable number of distinct values and serves as the foundation for more complex distributions.

Example
Consider a dataset representing the ages of individuals in a population below:
The corresponding simple frequency distribution table would be:

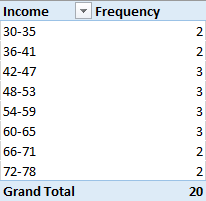
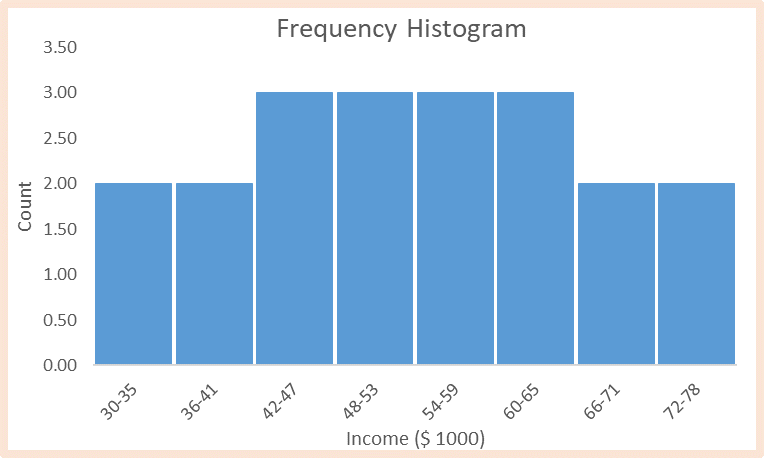
Grouped Frequency Distribution

In cases where the dataset contains a large number of unique values, it becomes impractical to list each value individually. Grouped frequency distribution involves categorizing data values into intervals or classes and summarizing the frequencies within each interval. It enhances the manageability and clarity of analysis for datasets with extensive ranges of values.

Example

Suppose we have a dataset representing the heights (in inches) of students:

92, 84, 80, 83, 83, 72, 67, 79, 63, 65, 67, 67, 84, 63, 83, 72, 67, 81, 72, 60

Grouping these heights into intervals of width 5 yields the following grouped frequency distribution table:

Height (Inches)

Number of Students (Frequency)

60-64

3

65-69

5

70-74

3
75-79

1

80-84

7
90-94

1

Total

20

Cumulative Frequency Distribution

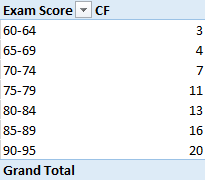
This type provides insights into the cumulative distribution of data values by accumulating frequencies as one progresses through the classes. It presents not only the frequency of each class but also the cumulative frequency up to that point. It aids in understanding the overall distribution pattern and cumulative trends within the dataset.

Example

Consider a dataset representing the number of daily steps taken by individuals in a study shown below:

5234, 4463, 8847, 5172, 5872, 7029, 6820, 8815, 7841, 6020, 5393, 5063, 5826, 5534, 6574, 6753, 8784, 5338, 6354, 6571

From this data, we get the below cumulative frequency distribution table for a grouped data:

Steps Per Day

Cumulative Steps
4463-4962

1

4963-5462

6
5463-5962

9

5963-6462

11
6463-6962

15

6963-7462

16
7463-7962

17

8463-8962

20

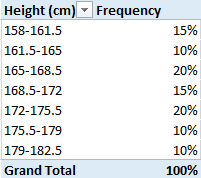
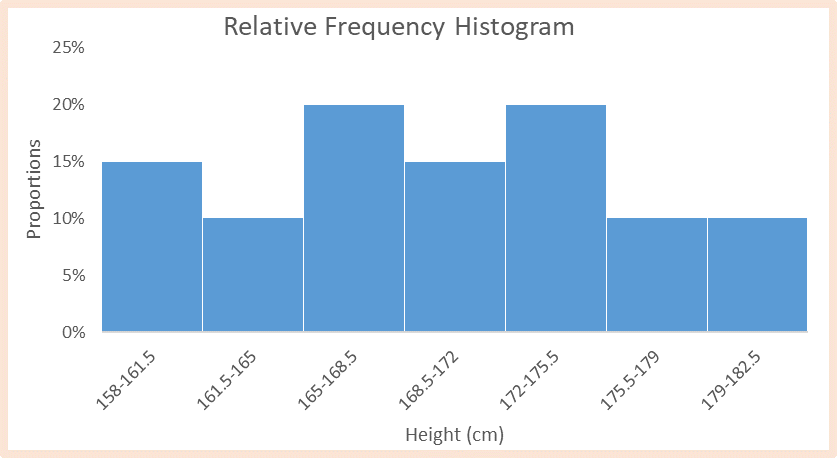
Relative Frequency Distribution

Unlike simple frequency distribution, which presents frequencies as absolute counts, relative frequency distribution expresses frequencies as proportions or percentages of the total dataset. It provides a standardized view of the distribution, facilitating comparative analysis. It allows for meaningful comparisons between datasets of varying sizes and serves as a basis for statistical inference and hypothesis testing.

Example

Let’s consider the below dataset representing the exam scores obtained by students in a given test:

87, 96, 99, 60, 75, 83, 76, 98, 79, 65, 97, 93, 62, 64, 66, 99, 99, 72, 88, 65

Constructing a relative frequency distribution table:

Exam Score

Performance (Percentage)
60-64

15%

65-69

15%
70-74

5%

75-79

15%
80-84

5%

85-89

10%
90-94

5%

95-99

30%
Total

100%

These examples demonstrate how different types of frequency distribution can be applied to diverse datasets, providing valuable insights into the distributional characteristics of the data.

Conclusion

Frequency distribution tables are invaluable tools for organizing, summarizing, and analyzing data in statistics. By understanding the types of frequency distribution and how to construct them, one can gain deeper insights into the distribution patterns of datasets, aiding in decision-making and problem-solving in various fields.

Needs help with similar assignment?

We are available 24x7 to deliver the best services and assignment ready within 3-4 hours? Order a custom-written, plagiarism-free paper

Get Answer Over WhatsApp Order Paper Now

Histogram: Definition, Types, Graph, and Examples

A histogram is a graphical representation of data that displays the frequency distribution of a dataset. It consists of a series of adjacent bars, where the height of each bar corresponds to the frequency or relative frequency of occurrences within each interval, also known as a bin.

Definition

A histogram visually represents the distribution of numerical data by dividing it into intervals or bins. It provides a clear picture of the central tendency, variability, and shape of the data. Histograms are widely used in statistics, data analysis, and various fields to understand the distribution patterns of datasets.

A typical histogram graph consists of two axes:

  • The X-axis (Horizontal Axis) represents the range of values or intervals of the data.
  • The Y-axis (Vertical Axis) represents the frequency, relative frequency, or cumulative frequency.

Each bar in the histogram corresponds to an interval on the X-axis, with the height of the bar indicating the frequency or relative frequency of observations within that interval.

Types and Examples

Frequency Histogram:

This type of histogram displays the frequency of occurrences within each interval. The height of each bar represents the absolute frequency.

Example

Consider the Income Distribution data in the table below:

Suppose you have a dataset concerning the income (in $1000) of 20 individuals. The histogram would represent the distribution of income across different income intervals, such as 0–10, 11–20, 21–30, and so on. Therefore, the first step is to create a frequency table before constructing a histogram (in cases where technology is not in use), as shown in the table below

From this point, we can use bar graphs to construct the histogram, with the intervals (income) placed on the x-axis and the frequency on the y-axis. The resultant histogram is shown below.

Relative Frequency Histogram

Instead of showing the absolute frequency, this type of histogram displays the proportion of occurrences within each interval relative to the total number of observations. The height of each bar represents the relative frequency.

Example

Consider the Height Distribution data in the table below:

Given such data, you can create a histogram to visualize the distribution of heights across various height intervals (e.g., 150–160 cm, 161–170 cm, etc.). Therefore, the first step is to create a relative frequency table before constructing a histogram (in cases where technology is not in use), as shown in the table below

From this point, we can use bar graphs to construct the histogram, with the intervals placed on the x-axis and the height proportions on the y-axis. The resultant histogram is shown below.

Cumulative Frequency Histogram:

In this histogram, each bar represents the cumulative frequency (CF) up to the corresponding interval. It helps visualize the total cumulative frequency distribution as the data progresses.

Example

Consider the exam score distribution data in the table below:

Given such data, you can create a histogram to visualize the distribution of scores across performance intervals (e.g., 10–20, 20–30, etc.). Therefore, the first step is to create a cumulative frequency table before constructing a histogram (in cases where technology is not in use), as shown in the table below

From this point, we can use bar graphs to construct the histogram, with the intervals (exam score) placed on the x-axis and the cumulative frequency on the y-axis. The resultant histogram is shown below.

In summary, histograms offer a powerful way to visually represent and interpret the distribution of data, making it easier to draw insights and make informed decisions in various fields ranging from finance to healthcare and beyond.

Needs help with similar assignment?

We are available 24x7 to deliver the best services and assignment ready within 3-4 hours? Order a custom-written, plagiarism-free paper

Get Answer Over WhatsApp Order Paper Now

Excelling in Elementary Statistics Made Easy

Are you struggling to grasp the fundamentals of elementary statistics? Don’t let confusion hold you back—CustomHomeworkHelp.com is your ultimate destination for mastering elementary statistics with ease. Our tailored homework help services are designed to demystify the core concepts of statistics, empowering you to achieve academic success with confidence.

Personalized Guidance for Every Elementary Concept

At CustomHomeworkHelp.com, we recognize that elementary statistics can pose significant challenges for many students. That’s why we offer personalized guidance tailored to your individual needs. Whether you’re grappling with mean, median, and mode or exploring the basics of probability, our team of experienced tutors is here to provide clear explanations and step-by-step guidance to help you succeed.

Active Learning Strategies for Lasting Understanding

Say goodbye to passive memorization and hello to active engagement with your elementary statistics coursework. Our interactive learning strategies are designed to promote active participation and a deep understanding of statistical concepts. Through hands-on practice exercises, real-world examples, and interactive tutorials, we’ll help you develop the skills and confidence you need to excel in elementary statistics and beyond.

Dive Deep into the Building Blocks of Statistics

Elementary statistics lays the foundation for more advanced statistical concepts, making it crucial to develop a strong understanding from the start. At CustomHomeworkHelp.com, we go beyond surface-level explanations to help you dive deep into the building blocks of statistics. Whether you’re learning about sampling techniques, probability distributions, or basic inferential statistics, our tutors will guide you through each concept with clarity and precision.

Flexible Support Tailored to Your Schedule

We understand that juggling coursework, extracurricular activities, and other obligations can be challenging. That’s why we offer flexible support options to accommodate your busy schedule. Whether you need help with a specific homework assignment or ongoing assistance throughout the semester, our team is here to support you whenever you need it. With 24/7 access to our online platform, you can get the help you need, whenever you need it.

Elevate Your Understanding of Elementary Statistics Today

Don’t let confusion hold you back from mastering elementary statistics. With CustomHomeworkHelp.com, you have the resources and support you need to succeed. Say goodbye to frustration and hello to confidence as you unlock your potential in elementary statistics. Visit our website today to learn more and take the first step toward academic excellence.

Needs help with similar assignment?

We are available 24x7 to deliver the best services and assignment ready within 3-4 hours? Order a custom-written, plagiarism-free paper

Get Answer Over WhatsApp Order Paper Now

Maximize Your Statistics Homework Success

Are you tired of staring blankly at your statistics homework, feeling overwhelmed by complex concepts and equations? CustomHomeworkHelp.com is here to rescue you from the clutches of statistical despair. Our website offers tailored statistics homework help services designed to empower you to conquer any statistical challenge with confidence.

Tailored Assistance for Every Statistical Conundrum

At CustomHomeworkHelp.com, we understand that statistics can be daunting for many students. That’s why we offer personalized assistance tailored to your specific needs. Whether you’re grappling with probability distributions, hypothesis testing, or regression analysis, our team of expert tutors is here to provide clarity and guidance every step of the way.

Active Learning for Lasting Results

Say goodbye to passive learning and hello to active engagement with your statistics coursework. Our approach emphasizes interactive learning techniques that encourage you to actively participate in the problem-solving process. From one-on-one tutoring sessions to interactive online modules, we offer a variety of resources to suit your preferred learning style and pace.

Dive Deep into Statistical Concepts

Statistics is more than just numbers—it’s a powerful tool for understanding the world around us. At CustomHomeworkHelp.com, we go beyond rote memorization to help you develop a deep conceptual understanding of statistical principles. Whether you’re exploring inferential statistics or delving into multivariate analysis, our tutors will guide you through the intricacies of each concept, ensuring that you not only complete your homework but also grasp the underlying theory.

Flexible Support Whenever You Need It

We understand that student life can be hectic, which is why we offer flexible support options to accommodate your busy schedule. Whether you need help with a last-minute assignment or ongoing assistance throughout the semester, our team is here to support you whenever you need it. With 24/7 access to our online platform, you can get the help you need, whenever you need it.

Elevate Your Academic Performance Today

Don’t let statistics stand in the way of your academic success. With CustomHomeworkHelp.com, you have the resources and support you need to excel in your statistics coursework. Say goodbye to frustration and hello to confidence as you unlock your potential with our customized statistics homework help services. Visit our website today to learn more and take the first step toward mastering statistics.

Needs help with similar assignment?

We are available 24x7 to deliver the best services and assignment ready within 3-4 hours? Order a custom-written, plagiarism-free paper

Get Answer Over WhatsApp Order Paper Now

Statistics Homework Solved

The Best Statistics Homework Help!

In search of the pinnacle of statistics homework assistance? Welcome to CustomHomeworkHelp.com, your ultimate solution for unparalleled support and guidance in conquering statistics assignments with ease.

Expertise That Sets Us Apart

At CustomHomeworkHelp.com, we take pride in our team of seasoned tutors, each a maestro in the realm of statistics. Armed with extensive experience and a fervor for teaching, our tutors possess the expertise needed to simplify even the most intricate statistical concepts. Whether you’re grappling with probability distributions, hypothesis testing, or multivariate analysis, our tutors are equipped to provide clear, concise explanations and comprehensive assistance.

Personalized Support Tailored to You

Recognizing that each student possesses unique learning styles and challenges, our approach is entirely personalized. When you choose CustomHomeworkHelp.com, you’ll be matched with a tutor who takes the time to understand your strengths, weaknesses, and goals. Whether you require visual aids, hands-on practice, or targeted guidance on specific topics, our tutors will tailor their approach to suit your preferences and needs.

Accessible Anytime, Anywhere

Statistics homework waits for no one, which is why CustomHomeworkHelp.com offers round-the-clock access to support. Whether it’s the dead of night or the crack of dawn, our tutors are available to assist whenever you need it. With our flexible scheduling and convenient online platform, you can tackle your assignments at your own pace and on your schedule.

Transparent Pricing, No Hidden Costs

Quality assistance shouldn’t come at a premium. That’s why CustomHomeworkHelp.com offers transparent pricing with no hidden fees or surprises. Our affordable rates and flexible payment options ensure that exceptional statistics homework help is within reach for all students. With us, you’ll receive exceptional value for your investment and the assurance of knowing exactly what you’re paying for.

Privacy and Security are assured.

We understand the importance of privacy and security when seeking online assistance. That’s why CustomHomeworkHelp.com prioritizes the confidentiality and security of your personal information. Our platform employs state-of-the-art encryption technology to safeguard your data, ensuring that your interactions with our tutors remain private and secure at all times.

Ready to Excel in Statistics?

Say goodbye to stress and confusion and hello to clarity and confidence with CustomHomeworkHelp.com. Join the ranks of satisfied students who have experienced the CustomHomeworkHelp.com difference and achieved academic success. Visit our website today and take the first step towards mastering statistics with ease and proficiency!

Needs help with similar assignment?

We are available 24x7 to deliver the best services and assignment ready within 3-4 hours? Order a custom-written, plagiarism-free paper

Get Answer Over WhatsApp Order Paper Now

Statistics Made Easy

Are you searching for a reliable solution to conquer your statistics homework? Look no further than our dedicated statistics homework help website! At CustomHomeworkHelp.com, we’re committed to providing you with the tools and support you need to excel in statistics effortlessly.

Expert Guidance at Your Fingertips

Our website boasts a team of experienced tutors who specialize in statistics. These experts are passionate about teaching and dedicated to simplifying even the most complex statistical concepts. With their guidance, you’ll gain a deeper understanding of key topics, from probability and hypothesis testing to regression analysis and more.

Tailored Assistance for Your Needs

We understand that every student has unique learning preferences and challenges. That’s why our approach is entirely personalized. When you turn to our homework help website, you’ll receive tailored assistance that addresses your specific needs and learning style. Whether you prefer visual explanations, hands-on practice, or additional guidance with particular topics, our tutors will adapt to suit your requirements.

Convenient Access, Anytime, Anywhere

Statistics homework can strike at any time, which is why our website offers convenient 24/7 access to support. Whether it’s late at night or early in the morning, our tutors are available to assist whenever you need it. With our flexible scheduling and round-the-clock availability, you can tackle your assignments on your terms.

Transparent Pricing, No Surprises

We believe in transparent pricing with no hidden costs or surprises. Our homework help website offers affordable rates and flexible payment options, ensuring that quality assistance is accessible to all students. With us, you’ll receive exceptional value for your investment and peace of mind knowing exactly what you’re paying for.

Privacy and Security are guaranteed.

Your privacy and security are our top priorities. Our website employs advanced encryption technology to safeguard your personal information and ensure that your interactions with our tutors remain confidential. You can trust us to protect your data and provide a safe learning environment for your statistics journey.

Ready to Succeed in Statistics?

Don’t let statistics homework hold you back any longer. With our homework help website by your side, you’ll tackle assignments with confidence and achieve the results you desire. Join the thousands of students who have benefited from our expertise and take the first step towards mastering statistics today.

Visit CustomHomeworkHelp.com now to experience the difference our homework help website can make in your academic journey!

Needs help with similar assignment?

We are available 24x7 to deliver the best services and assignment ready within 3-4 hours? Order a custom-written, plagiarism-free paper

Get Answer Over WhatsApp Order Paper Now
© Copyright 2024 Custom Homework Help