Box and Whisker Plot Explained: Definition, Interpretation, and Examples

In the world of statistics and data visualization, the box and whisker plot, also known as the box plot, stands as a powerful tool for summarizing and understanding the distribution of a dataset. Whether you’re a student grappling with your first statistics course or a seasoned data analyst deciphering complex datasets, mastering the art of interpreting box plots can unlock valuable insights and inform data-driven decisions. In this blog, we’ll delve into the definition, interpretation, and examples of box and whisker plots to demystify this essential statistical technique.

What is a Box and Whisker Plot?

A box and whisker plot is a graphical representation of the distribution of a dataset through five summary statistics a shown in the figure below:

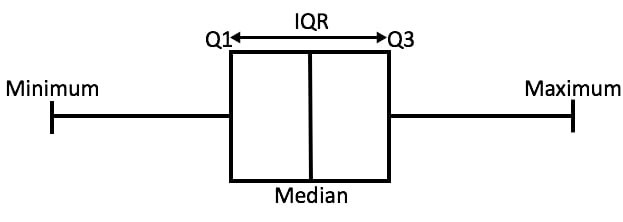
Visually, it comprises a rectangular “box” and two “whiskers” extending from either end of the box. The box encapsulates the interquartile range (IQR), which spans from the first quartile to the third quartile, while the whiskers represent the range of the data beyond the quartiles. Outliers, if present, are typically depicted as individual points beyond the whiskers.

Functions

Box and whisker plots are widely used in data analysis and statistics for several purposes:

  1. Summary of Data Distribution: Box plots provide a concise summary of the distribution of a dataset, including measures of central tendency (such as the median) and variability (such as the interquartile range). They offer a visual representation of the spread and shape of the data, making it easier to interpret than raw numerical values.
  2. Comparison of Groups: Box plots are effective tools for comparing the distributions of different groups or categories within a dataset. By plotting multiple box plots side by side, analysts can visually assess differences in central tendency, spread, and variability between groups, aiding in comparative analysis and hypothesis testing.
  3. Identification of Outliers: Outliers, or data points that deviate significantly from the rest of the dataset, can have a significant impact on statistical analyses and conclusions. Box plots help identify outliers by visually highlighting data points that fall outside the whiskers, enabling analysts to investigate potential anomalies and assess their impact on the overall dataset.
  4. Detection of Skewness and Symmetry: Box plots can reveal patterns of skewness or symmetry in the distribution of data. A symmetrical distribution will have a box plot where the median line is approximately centered within the box, while skewed distributions will have the median line shifted towards one end of the box. This information is valuable for understanding the underlying characteristics of the data and selecting appropriate statistical methods for analysis.
  5. Visualization of Variability: Box plots provide a clear visualization of the variability within a dataset, as indicated by the length of the whiskers and the size of the box. Larger variability is represented by longer whiskers, while smaller variability is indicated by shorter whiskers. Understanding variability is crucial for assessing the reliability and stability of data measurements.
  6. Monitoring Process Performance: In quality control and process improvement applications, box plots are used to monitor the performance of manufacturing processes or system outputs over time. By plotting key process metrics on box plots at regular intervals, analysts can identify shifts, trends, or abnormalities in the process performance, facilitating timely intervention and corrective action.

Interpreting a Box and Whisker Plot

Now, let’s break down the components of a box and whisker plot and unravel the insights they offer:

  1. Median (Q2): The line inside the box denotes the median, or the middle value of the dataset when arranged in ascending order. It serves as a measure of central tendency, dividing the data into two equal halves.
  2. Quartiles (Q1 and Q3): The lower boundary of the box represents the first quartile (Q1), while the upper boundary corresponds to the third quartile (Q3). These quartiles delineate the middle 50% of the data and offer insights into the spread of values around the median.
  3. Interquartile Range (IQR): The length of the box, spanning from Q1 to Q3, defines the interquartile range (IQR). It encapsulates the central 50% of the dataset and provides a measure of dispersion that is robust against outliers.
  4. Whiskers: The whiskers extend from the edges of the box to the minimum and maximum values within a predefined range, typically 1.5 times the IQR. They offer a visual representation of the spread of the data beyond the quartiles, highlighting the range of typical values.
  5. Outliers: Individual data points lying beyond the whiskers are considered outliers and are often depicted as distinct symbols on the plot. These outliers warrant further investigation as they may signify anomalies or errors in the data.
Example

Let’s illustrate the utility of box plots with a few examples:

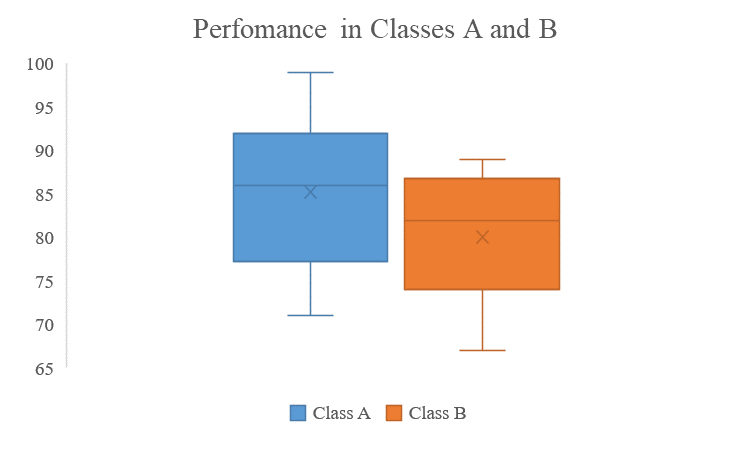
Exam Scores: Suppose we have the exam scores of two classes, Class A and Class B. By comparing the box plots of their scores, we can discern differences in the central tendency, spread, and presence of outliers, offering insights into the performance distribution of the two classes.

consider the data below

Class A: 72, 92, 98, 93, 89, 83, 89, 93, 78, 99, 83, 92, 77, 72, 83, 92, 77, 92, 71, 80

Class B: 88, 81, 69, 80, 89, 76, 74, 87, 85, 89, 71, 74, 86, 83, 75, 72, 67, 87, 85, 83

From this data, we can get the below box and whisker plot

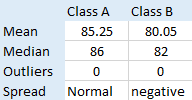
summary of the findings
Temperature Variation: A meteorologist analyzing temperature data over different seasons can use box plots to visualize the variability in temperature distribution. The box plot may reveal seasonal trends, identify extreme temperature outliers, and aid in climate analysis.

consider the sample data below representing four seasons in a year

Spring: 13, 22, 24, 22, 19, 13, 25, 15, 24, 20, 23, 20, 21, 22, 20, 17, 25, 18, 15, 14

Winter: 2, 7, -2, 4, 5, 7, 7, -5, -3, -4, 7, 5, 6, -1, -4, 7, 1, -2, 3, 4

Fall: 13, 17, 18, 15, 12, 13, 10, 21, 21, 10, 14, 11, 11, 10, 22, 21, 20, 14, 10, 21

Summer: 23, 26, 24, 23, 27, 35, 32, 32, 27, 23, 31, 35, 29, 32, 29, 25, 27, 33, 25, 23

From this data, we can get the below box and whisker plot

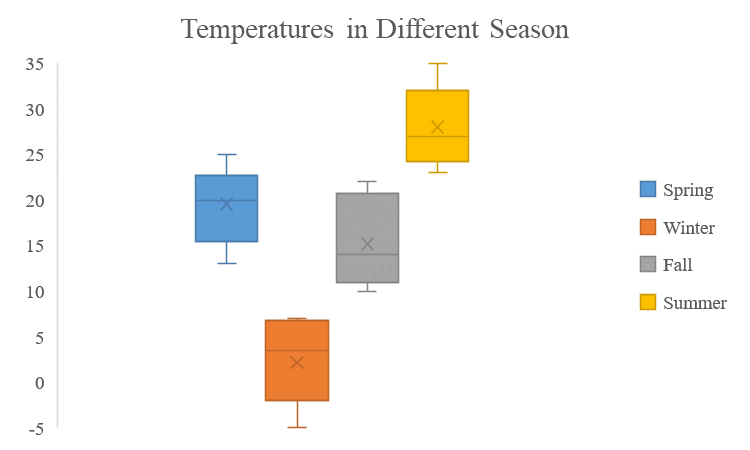
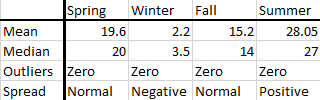
The resultant summary results is as shown in the summary below

Conclusion

In summary, the box and whisker plot serves as a versatile and intuitive tool for summarizing the distribution of numerical data. By encapsulating key summary statistics in a visually accessible format, box plots enable researchers, analysts, and decision-makers to glean valuable insights, identify patterns, and detect anomalies within datasets. Whether you’re exploring academic performance, meteorological trends, or financial indicators, mastering the interpretation of box plots empowers you to extract meaningful information and make informed decisions based on data-driven evidence.

Needs help with similar assignment?

We are available 24x7 to deliver the best services and assignment ready within 3-4 hours? Order a custom-written, plagiarism-free paper

Get Answer Over WhatsApp Order Paper Now

Frequency Distribution: Tables, Types & Examples

Frequency distribution is a fundamental concept in statistics that helps in organizing and summarizing data. By presenting data in a tabular format, frequency distribution facilitates analysis and interpretation. In this blog post, we will delve into the basics of frequency distribution, explore different types, and provide examples to enhance understanding.

What is Frequency Distribution?

Frequency distribution is a foundational concept in statistics, serving as a methodical approach to organizing and analyzing data. At its core, frequency distribution entails categorizing data values based on how frequently they occur within a dataset. This categorization is typically presented in the form of a table, where each unique value (or range of values) is paired with its corresponding frequency or count.

Components
  • Data Values: These are the individual observations or measurements within a dataset. They could represent anything from test scores and ages to product sales or temperature readings.
  • Frequency: This refers to the number of times a specific data value occurs within the dataset. It quantifies the occurrence or repetition of each value and provides insight into its relative importance within the dataset.
Constructing a Frequency Distribution
  1. Identification of Data Set: The process begins by identifying the complete range of data values present in the dataset. This involves examining all the individual observations to determine the scope of the data.
  2. Categorization into Classes: Once the range of data values is established, it is divided into distinct intervals or classes. These classes are mutually exclusive and collectively exhaustive, ensuring that every data value falls into one and only one class.
  3. Counting Frequencies: Each data value is then assigned to its respective class, and the frequency of occurrences within each class is tallied. This involves counting the number of times each value falls within its designated class.
  4. Tabular Representation: The final step involves organizing the classes and their corresponding frequencies into a structured table format. This frequency distribution table provides a clear and concise summary of the distribution of data values within the dataset.
Significance and Utility

Frequency distribution serves several critical purposes in statistical analysis

  • Pattern Recognition: By summarizing the distribution of data values, frequency distribution allows analysts to identify patterns, trends, and outliers within the dataset.
  • Data Summarization: It provides a succinct summary of the dataset’s characteristics, making it easier to comprehend and interpret complex data.
  • Decision Making: Frequency distribution informs decision-making processes by providing valuable insights into the distribution and frequency of various data values, aiding in forecasting, planning, and problem-solving endeavors.

In essence, frequency distribution serves as a cornerstone of statistical analysis, providing a structured framework for understanding the distributional properties of data and facilitating informed decision-making processes.

Types of Frequency Distribution

Frequency distribution manifests in various forms, each catering to specific data characteristics and analytical needs. Here are the primary types:

Simple Frequency Distribution

This type enumerates all unique data values in the dataset alongside their respective frequencies. It is ideal for datasets with a manageable number of distinct values and serves as the foundation for more complex distributions.

Example
Consider a dataset representing the ages of individuals in a population below:
The corresponding simple frequency distribution table would be:

Grouped Frequency Distribution

In cases where the dataset contains a large number of unique values, it becomes impractical to list each value individually. Grouped frequency distribution involves categorizing data values into intervals or classes and summarizing the frequencies within each interval. It enhances the manageability and clarity of analysis for datasets with extensive ranges of values.

Example

Suppose we have a dataset representing the heights (in inches) of students:

92, 84, 80, 83, 83, 72, 67, 79, 63, 65, 67, 67, 84, 63, 83, 72, 67, 81, 72, 60

Grouping these heights into intervals of width 5 yields the following grouped frequency distribution table:

Height (Inches)

Number of Students (Frequency)

60-64

3

65-69

5

70-74

3
75-79

1

80-84

7
90-94

1

Total

20

Cumulative Frequency Distribution

This type provides insights into the cumulative distribution of data values by accumulating frequencies as one progresses through the classes. It presents not only the frequency of each class but also the cumulative frequency up to that point. It aids in understanding the overall distribution pattern and cumulative trends within the dataset.

Example

Consider a dataset representing the number of daily steps taken by individuals in a study shown below:

5234, 4463, 8847, 5172, 5872, 7029, 6820, 8815, 7841, 6020, 5393, 5063, 5826, 5534, 6574, 6753, 8784, 5338, 6354, 6571

From this data, we get the below cumulative frequency distribution table for a grouped data:

Steps Per Day

Cumulative Steps
4463-4962

1

4963-5462

6
5463-5962

9

5963-6462

11
6463-6962

15

6963-7462

16
7463-7962

17

8463-8962

20

Relative Frequency Distribution

Unlike simple frequency distribution, which presents frequencies as absolute counts, relative frequency distribution expresses frequencies as proportions or percentages of the total dataset. It provides a standardized view of the distribution, facilitating comparative analysis. It allows for meaningful comparisons between datasets of varying sizes and serves as a basis for statistical inference and hypothesis testing.

Example

Let’s consider the below dataset representing the exam scores obtained by students in a given test:

87, 96, 99, 60, 75, 83, 76, 98, 79, 65, 97, 93, 62, 64, 66, 99, 99, 72, 88, 65

Constructing a relative frequency distribution table:

Exam Score

Performance (Percentage)
60-64

15%

65-69

15%
70-74

5%

75-79

15%
80-84

5%

85-89

10%
90-94

5%

95-99

30%
Total

100%

These examples demonstrate how different types of frequency distribution can be applied to diverse datasets, providing valuable insights into the distributional characteristics of the data.

Conclusion

Frequency distribution tables are invaluable tools for organizing, summarizing, and analyzing data in statistics. By understanding the types of frequency distribution and how to construct them, one can gain deeper insights into the distribution patterns of datasets, aiding in decision-making and problem-solving in various fields.

Needs help with similar assignment?

We are available 24x7 to deliver the best services and assignment ready within 3-4 hours? Order a custom-written, plagiarism-free paper

Get Answer Over WhatsApp Order Paper Now

Histogram: Definition, Types, Graph, and Examples

A histogram is a graphical representation of data that displays the frequency distribution of a dataset. It consists of a series of adjacent bars, where the height of each bar corresponds to the frequency or relative frequency of occurrences within each interval, also known as a bin.

Definition

A histogram visually represents the distribution of numerical data by dividing it into intervals or bins. It provides a clear picture of the central tendency, variability, and shape of the data. Histograms are widely used in statistics, data analysis, and various fields to understand the distribution patterns of datasets.

A typical histogram graph consists of two axes:

  • The X-axis (Horizontal Axis) represents the range of values or intervals of the data.
  • The Y-axis (Vertical Axis) represents the frequency, relative frequency, or cumulative frequency.

Each bar in the histogram corresponds to an interval on the X-axis, with the height of the bar indicating the frequency or relative frequency of observations within that interval.

Types and Examples

Frequency Histogram:

This type of histogram displays the frequency of occurrences within each interval. The height of each bar represents the absolute frequency.

Example

Consider the Income Distribution data in the table below:

Suppose you have a dataset concerning the income (in $1000) of 20 individuals. The histogram would represent the distribution of income across different income intervals, such as 0–10, 11–20, 21–30, and so on. Therefore, the first step is to create a frequency table before constructing a histogram (in cases where technology is not in use), as shown in the table below

From this point, we can use bar graphs to construct the histogram, with the intervals (income) placed on the x-axis and the frequency on the y-axis. The resultant histogram is shown below.

Relative Frequency Histogram

Instead of showing the absolute frequency, this type of histogram displays the proportion of occurrences within each interval relative to the total number of observations. The height of each bar represents the relative frequency.

Example

Consider the Height Distribution data in the table below:

Given such data, you can create a histogram to visualize the distribution of heights across various height intervals (e.g., 150–160 cm, 161–170 cm, etc.). Therefore, the first step is to create a relative frequency table before constructing a histogram (in cases where technology is not in use), as shown in the table below

From this point, we can use bar graphs to construct the histogram, with the intervals placed on the x-axis and the height proportions on the y-axis. The resultant histogram is shown below.

Cumulative Frequency Histogram:

In this histogram, each bar represents the cumulative frequency (CF) up to the corresponding interval. It helps visualize the total cumulative frequency distribution as the data progresses.

Example

Consider the exam score distribution data in the table below:

Given such data, you can create a histogram to visualize the distribution of scores across performance intervals (e.g., 10–20, 20–30, etc.). Therefore, the first step is to create a cumulative frequency table before constructing a histogram (in cases where technology is not in use), as shown in the table below

From this point, we can use bar graphs to construct the histogram, with the intervals (exam score) placed on the x-axis and the cumulative frequency on the y-axis. The resultant histogram is shown below.

In summary, histograms offer a powerful way to visually represent and interpret the distribution of data, making it easier to draw insights and make informed decisions in various fields ranging from finance to healthcare and beyond.

Needs help with similar assignment?

We are available 24x7 to deliver the best services and assignment ready within 3-4 hours? Order a custom-written, plagiarism-free paper

Get Answer Over WhatsApp Order Paper Now

Excelling in Elementary Statistics Made Easy

Are you struggling to grasp the fundamentals of elementary statistics? Don’t let confusion hold you back—CustomHomeworkHelp.com is your ultimate destination for mastering elementary statistics with ease. Our tailored homework help services are designed to demystify the core concepts of statistics, empowering you to achieve academic success with confidence.

Personalized Guidance for Every Elementary Concept

At CustomHomeworkHelp.com, we recognize that elementary statistics can pose significant challenges for many students. That’s why we offer personalized guidance tailored to your individual needs. Whether you’re grappling with mean, median, and mode or exploring the basics of probability, our team of experienced tutors is here to provide clear explanations and step-by-step guidance to help you succeed.

Active Learning Strategies for Lasting Understanding

Say goodbye to passive memorization and hello to active engagement with your elementary statistics coursework. Our interactive learning strategies are designed to promote active participation and a deep understanding of statistical concepts. Through hands-on practice exercises, real-world examples, and interactive tutorials, we’ll help you develop the skills and confidence you need to excel in elementary statistics and beyond.

Dive Deep into the Building Blocks of Statistics

Elementary statistics lays the foundation for more advanced statistical concepts, making it crucial to develop a strong understanding from the start. At CustomHomeworkHelp.com, we go beyond surface-level explanations to help you dive deep into the building blocks of statistics. Whether you’re learning about sampling techniques, probability distributions, or basic inferential statistics, our tutors will guide you through each concept with clarity and precision.

Flexible Support Tailored to Your Schedule

We understand that juggling coursework, extracurricular activities, and other obligations can be challenging. That’s why we offer flexible support options to accommodate your busy schedule. Whether you need help with a specific homework assignment or ongoing assistance throughout the semester, our team is here to support you whenever you need it. With 24/7 access to our online platform, you can get the help you need, whenever you need it.

Elevate Your Understanding of Elementary Statistics Today

Don’t let confusion hold you back from mastering elementary statistics. With CustomHomeworkHelp.com, you have the resources and support you need to succeed. Say goodbye to frustration and hello to confidence as you unlock your potential in elementary statistics. Visit our website today to learn more and take the first step toward academic excellence.

Needs help with similar assignment?

We are available 24x7 to deliver the best services and assignment ready within 3-4 hours? Order a custom-written, plagiarism-free paper

Get Answer Over WhatsApp Order Paper Now

Maximize Your Statistics Homework Success

Are you tired of staring blankly at your statistics homework, feeling overwhelmed by complex concepts and equations? CustomHomeworkHelp.com is here to rescue you from the clutches of statistical despair. Our website offers tailored statistics homework help services designed to empower you to conquer any statistical challenge with confidence.

Tailored Assistance for Every Statistical Conundrum

At CustomHomeworkHelp.com, we understand that statistics can be daunting for many students. That’s why we offer personalized assistance tailored to your specific needs. Whether you’re grappling with probability distributions, hypothesis testing, or regression analysis, our team of expert tutors is here to provide clarity and guidance every step of the way.

Active Learning for Lasting Results

Say goodbye to passive learning and hello to active engagement with your statistics coursework. Our approach emphasizes interactive learning techniques that encourage you to actively participate in the problem-solving process. From one-on-one tutoring sessions to interactive online modules, we offer a variety of resources to suit your preferred learning style and pace.

Dive Deep into Statistical Concepts

Statistics is more than just numbers—it’s a powerful tool for understanding the world around us. At CustomHomeworkHelp.com, we go beyond rote memorization to help you develop a deep conceptual understanding of statistical principles. Whether you’re exploring inferential statistics or delving into multivariate analysis, our tutors will guide you through the intricacies of each concept, ensuring that you not only complete your homework but also grasp the underlying theory.

Flexible Support Whenever You Need It

We understand that student life can be hectic, which is why we offer flexible support options to accommodate your busy schedule. Whether you need help with a last-minute assignment or ongoing assistance throughout the semester, our team is here to support you whenever you need it. With 24/7 access to our online platform, you can get the help you need, whenever you need it.

Elevate Your Academic Performance Today

Don’t let statistics stand in the way of your academic success. With CustomHomeworkHelp.com, you have the resources and support you need to excel in your statistics coursework. Say goodbye to frustration and hello to confidence as you unlock your potential with our customized statistics homework help services. Visit our website today to learn more and take the first step toward mastering statistics.

Needs help with similar assignment?

We are available 24x7 to deliver the best services and assignment ready within 3-4 hours? Order a custom-written, plagiarism-free paper

Get Answer Over WhatsApp Order Paper Now

Statistics Homework Solved

The Best Statistics Homework Help!

In search of the pinnacle of statistics homework assistance? Welcome to CustomHomeworkHelp.com, your ultimate solution for unparalleled support and guidance in conquering statistics assignments with ease.

Expertise That Sets Us Apart

At CustomHomeworkHelp.com, we take pride in our team of seasoned tutors, each a maestro in the realm of statistics. Armed with extensive experience and a fervor for teaching, our tutors possess the expertise needed to simplify even the most intricate statistical concepts. Whether you’re grappling with probability distributions, hypothesis testing, or multivariate analysis, our tutors are equipped to provide clear, concise explanations and comprehensive assistance.

Personalized Support Tailored to You

Recognizing that each student possesses unique learning styles and challenges, our approach is entirely personalized. When you choose CustomHomeworkHelp.com, you’ll be matched with a tutor who takes the time to understand your strengths, weaknesses, and goals. Whether you require visual aids, hands-on practice, or targeted guidance on specific topics, our tutors will tailor their approach to suit your preferences and needs.

Accessible Anytime, Anywhere

Statistics homework waits for no one, which is why CustomHomeworkHelp.com offers round-the-clock access to support. Whether it’s the dead of night or the crack of dawn, our tutors are available to assist whenever you need it. With our flexible scheduling and convenient online platform, you can tackle your assignments at your own pace and on your schedule.

Transparent Pricing, No Hidden Costs

Quality assistance shouldn’t come at a premium. That’s why CustomHomeworkHelp.com offers transparent pricing with no hidden fees or surprises. Our affordable rates and flexible payment options ensure that exceptional statistics homework help is within reach for all students. With us, you’ll receive exceptional value for your investment and the assurance of knowing exactly what you’re paying for.

Privacy and Security are assured.

We understand the importance of privacy and security when seeking online assistance. That’s why CustomHomeworkHelp.com prioritizes the confidentiality and security of your personal information. Our platform employs state-of-the-art encryption technology to safeguard your data, ensuring that your interactions with our tutors remain private and secure at all times.

Ready to Excel in Statistics?

Say goodbye to stress and confusion and hello to clarity and confidence with CustomHomeworkHelp.com. Join the ranks of satisfied students who have experienced the CustomHomeworkHelp.com difference and achieved academic success. Visit our website today and take the first step towards mastering statistics with ease and proficiency!

Needs help with similar assignment?

We are available 24x7 to deliver the best services and assignment ready within 3-4 hours? Order a custom-written, plagiarism-free paper

Get Answer Over WhatsApp Order Paper Now

Statistics Made Easy

Are you searching for a reliable solution to conquer your statistics homework? Look no further than our dedicated statistics homework help website! At CustomHomeworkHelp.com, we’re committed to providing you with the tools and support you need to excel in statistics effortlessly.

Expert Guidance at Your Fingertips

Our website boasts a team of experienced tutors who specialize in statistics. These experts are passionate about teaching and dedicated to simplifying even the most complex statistical concepts. With their guidance, you’ll gain a deeper understanding of key topics, from probability and hypothesis testing to regression analysis and more.

Tailored Assistance for Your Needs

We understand that every student has unique learning preferences and challenges. That’s why our approach is entirely personalized. When you turn to our homework help website, you’ll receive tailored assistance that addresses your specific needs and learning style. Whether you prefer visual explanations, hands-on practice, or additional guidance with particular topics, our tutors will adapt to suit your requirements.

Convenient Access, Anytime, Anywhere

Statistics homework can strike at any time, which is why our website offers convenient 24/7 access to support. Whether it’s late at night or early in the morning, our tutors are available to assist whenever you need it. With our flexible scheduling and round-the-clock availability, you can tackle your assignments on your terms.

Transparent Pricing, No Surprises

We believe in transparent pricing with no hidden costs or surprises. Our homework help website offers affordable rates and flexible payment options, ensuring that quality assistance is accessible to all students. With us, you’ll receive exceptional value for your investment and peace of mind knowing exactly what you’re paying for.

Privacy and Security are guaranteed.

Your privacy and security are our top priorities. Our website employs advanced encryption technology to safeguard your personal information and ensure that your interactions with our tutors remain confidential. You can trust us to protect your data and provide a safe learning environment for your statistics journey.

Ready to Succeed in Statistics?

Don’t let statistics homework hold you back any longer. With our homework help website by your side, you’ll tackle assignments with confidence and achieve the results you desire. Join the thousands of students who have benefited from our expertise and take the first step towards mastering statistics today.

Visit CustomHomeworkHelp.com now to experience the difference our homework help website can make in your academic journey!

Needs help with similar assignment?

We are available 24x7 to deliver the best services and assignment ready within 3-4 hours? Order a custom-written, plagiarism-free paper

Get Answer Over WhatsApp Order Paper Now

Unmatched Quality in Stat Homework Assistance: CustomHomeworkHelp.com!

Struggling with statistics assignments? Feeling lost amidst the sea of data and formulas? Look no further! CustomHomeworkHelp.com is your ultimate destination for top-notch statistics homework assistance. Our platform is designed to provide you with the best-in-class support, ensuring that you not only tackle your assignments with ease but also gain a deeper understanding of statistical concepts.

Expert Tutors, Exceptional Guidance

At CustomHomeworkHelp.com, we pride ourselves on our team of expert tutors who are masters in the field of statistics. Equipped with years of experience and a passion for teaching, our tutors go above and beyond to simplify complex statistical topics. Whether you’re grappling with probability theory, sampling techniques, or inferential statistics, our tutors are here to provide clear explanations and comprehensive guidance.

Tailored Solutions for Every Student

We understand that every student has unique learning needs and preferences. That’s why our approach at CustomHomeworkHelp.com is entirely personalized. When you choose our services, you’ll be matched with a tutor who takes the time to understand your strengths, weaknesses, and learning styles. Whether you thrive on visual aids, prefer hands-on practice, or require extra guidance with specific topics, our tutors will tailor their approach to suit your requirements.

Accessible Anytime, Anywhere

Statistics homework doesn’t adhere to a strict schedule, and neither do we. CustomHomeworkHelp.com offers 24/7 access to support, ensuring that help is always available whenever you need it. Whether you’re burning the midnight oil or squeezing in a study session during your lunch break, our tutors are here to provide timely assistance and support.

Transparent Pricing, No Hidden Costs

Quality statistics help shouldn’t come with a hefty price tag. At CustomHomeworkHelp.com, we believe in transparent pricing with no hidden costs. Our affordable rates and flexible payment options ensure that you can access the best statistics homework help without breaking the bank. With us, you’ll get exceptional value for your money and unparalleled support throughout your academic journey.

Your Privacy, Our Priority

We understand the importance of privacy and security when seeking online assistance. That’s why CustomHomeworkHelp.com prioritizes the confidentiality and security of your personal information. Our platform employs advanced encryption technology to safeguard your data, ensuring that your interactions with our tutors remain private and secure at all times.

Experience the CustomHomeworkHelp.com Difference Today!

Don’t let statistics homework stress you out any longer. With CustomHomeworkHelp.com, you can bid farewell to confusion and frustration and embrace confidence and clarity in your assignments. Join thousands of satisfied students who have experienced the CustomHomeworkHelp.com difference and achieved academic success.

Ready to excel in statistics? Visit CustomHomeworkHelp.com now and embark on your journey towards mastering statistics with ease and confidence!

Needs help with similar assignment?

We are available 24x7 to deliver the best services and assignment ready within 3-4 hours? Order a custom-written, plagiarism-free paper

Get Answer Over WhatsApp Order Paper Now

Ace Your Statistics Homework with CustomHomeworkHelp.com!

Are you feeling overwhelmed by your statistics homework? Do the numbers seem to blur together, leaving you scratching your head in confusion? Fear not! CustomHomeworkHelp.com is here to rescue you from the clutches of statistical despair. Our online platform offers tailored solutions to all your statistics homework woes, ensuring that you not only understand the concepts but also excel in your assignments.

Expert Guidance, Anytime, Anywhere

At CustomHomeworkHelp.com, we understand that statistics can be a daunting subject for many students. That’s why we’ve assembled a team of experienced tutors who are passionate about simplifying complex statistical concepts. Whether you’re grappling with probability distributions, hypothesis testing, or regression analysis, our tutors are here to provide step-by-step guidance tailored to your learning style.

Personalized Approach for Maximum Results

We believe that one size does not fit all when it comes to learning statistics. That’s why our approach is entirely personalized to meet your specific needs. When you choose CustomHomeworkHelp.com, you’ll work with a tutor who takes the time to understand your strengths, weaknesses, and learning goals. Whether you prefer visual explanations, real-world examples, or hands-on practice, our tutors will adapt their teaching methods to suit your preferences.

24/7 Access to Support

We understand that statistics homework doesn’t always adhere to a 9-to-5 schedule. That’s why CustomHomeworkHelp.com offers round-the-clock support, ensuring that help is always just a click away. Whether you’re burning the midnight oil or squeezing in a study session during your lunch break, our tutors are available to provide the assistance you need, whenever you need it.

Affordable Pricing, No Hidden Fees

We believe that quality statistics should be accessible to all students, regardless of their budget. That’s why CustomHomeworkHelp.com offers transparent pricing with no hidden fees. With affordable rates and flexible payment options, you can get the assistance you need without breaking the bank.

Confidential and Secure

Your privacy and security are our top priorities at CustomHomeworkHelp.com. We use state-of-the-art encryption technology to ensure that your personal information remains confidential at all times. Whether you’re sharing files, communicating with your tutor, or making payments, you can rest assured that your data is safe and secure.

Don’t Let Statistics Stress You Out!

Say goodbye to sleepless nights and stressful study sessions. With CustomHomeworkHelp.com by your side, conquering your statistics homework has never been easier. Sign up today and experience the difference personalized, expert guidance can make in your academic journey.

Ready to get started? Visit CustomHomeworkHelp.com now and take the first step towards statistical success!

Needs help with similar assignment?

We are available 24x7 to deliver the best services and assignment ready within 3-4 hours? Order a custom-written, plagiarism-free paper

Get Answer Over WhatsApp Order Paper Now

Ace Your Statistics Homework with CustomHomeworkHelp.com

Are you feeling overwhelmed by the complexities of statistics homework? Don’t worry; you’re not alone. Statistics can be a challenging subject for many students, requiring a solid understanding of concepts and proficient problem-solving skills. But fear not! CustomHomeworkHelp.com is here to alleviate your stress and help you excel in statistics.

Our website, CustomHomeworkHelp.com, is your ultimate destination for online statistics homework assistance. We understand the struggles students face when tackling statistics assignments, which is why we’ve curated a team of expert tutors who are ready to guide you through every step of the way.

With CustomHomeworkHelp.com, you can bid farewell to late-night cramming sessions and frustrating Google searches. Our platform offers personalized assistance tailored to your specific needs. Whether you’re grappling with probability, hypothesis testing, regression analysis, or any other statistical concept, our tutors are equipped to provide clear explanations and hands-on guidance.

Why Choose CustomHomeworkHelp.com?

Expert Tutors: Our team comprises experienced tutors with a profound understanding of statistics. They hold advanced degrees in mathematics and related fields, ensuring that you receive top-notch guidance.

Customized Solutions: We recognize that every student has unique learning requirements. That’s why we offer personalized solutions crafted to address your challenges and enhance your understanding of statistical concepts.

Timely Assistance: Tight deadline? No problem! Our tutors are available around the clock to provide immediate assistance. Whether you need help with a last-minute assignment or ongoing support throughout the semester, we’ve got you covered.

Interactive Learning: Forget dull lectures and static textbooks. At CustomHomeworkHelp.com, learning is interactive and engaging. Our tutors utilize innovative teaching methods to make complex statistical concepts comprehensible and enjoyable.

Affordable Rates: We believe that quality education should be accessible to all. That’s why we offer competitive rates without compromising on the excellence of our services. Say goodbye to exorbitant tutoring fees and hello to affordable academic support.

How It Works:

Submit Your Assignment: Simply upload your statistics homework on our website, providing any specific instructions or requirements.

Receive a Quote: You’ll get a quote for your assignment based on its complexity and urgency. Rest assured, our pricing is transparent with no hidden fees.

Connect with a Tutor: Once you approve the quote, we’ll match you with a suitable tutor who specializes in your area of study.

Get Expert Assistance: Work one-on-one with your tutor to tackle your statistics homework. Ask questions, seek clarification, and receive step-by-step guidance until you grasp the concepts fully.

Review and Revise: Before submission, review the completed assignment and request revisions if necessary. Your satisfaction is our priority, and we’re committed to delivering work of the highest quality.

Don’t let statistics homework be a source of stress and anxiety. Take advantage of CustomHomeworkHelp.com‘s reliable and affordable online statistics homework assistance today. With our expert guidance, you’ll not only ace your assignments but also develop a deeper appreciation for the fascinating world of statistics. Get started now and embark on your journey towards academic success!

Needs help with similar assignment?

We are available 24x7 to deliver the best services and assignment ready within 3-4 hours? Order a custom-written, plagiarism-free paper

Get Answer Over WhatsApp Order Paper Now